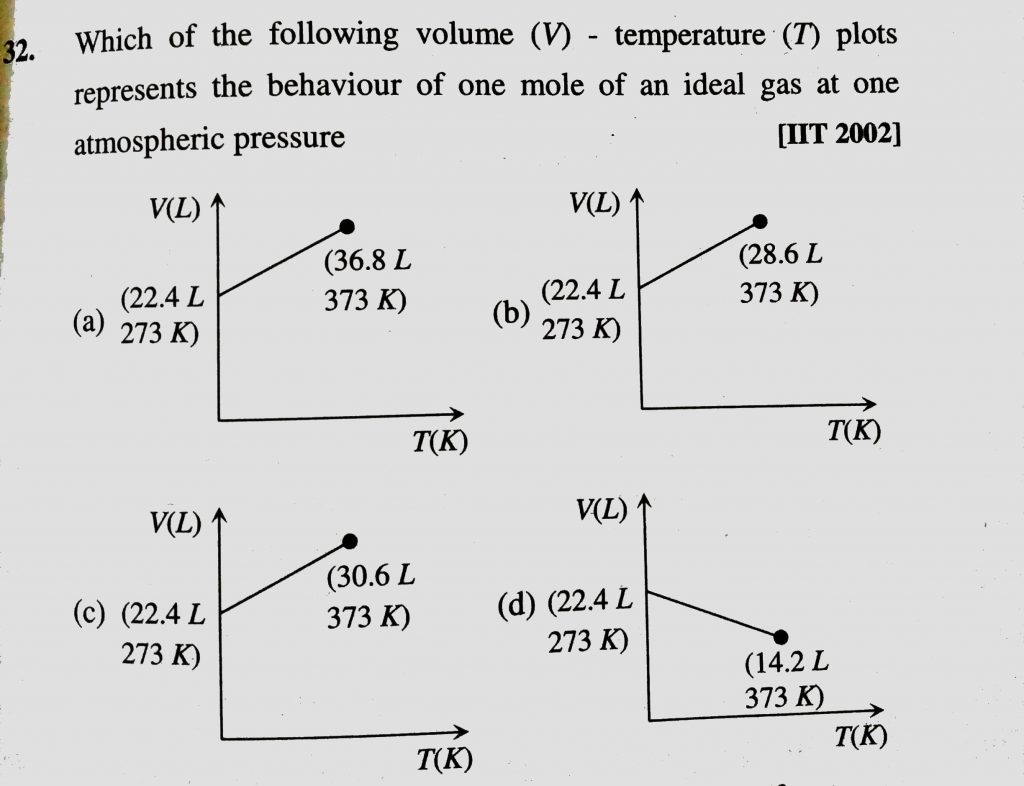
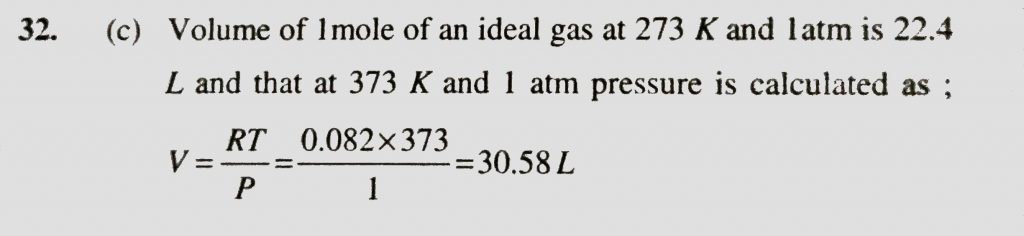
Which of the following volume (V) – temperature (T) plots represents the behaviour of one mole of an ideal gas at one atmospheric pressure Which of the following volume (V) - temperature (T) plots represents the behaviour of one mole of an ideal gas at one atmospheric pressure February 12, 2021 Category: Uncategorised (JEE Advanced Physics by BM Sharma + GMP Solutions) , Facebook Messenger WhatsApp Share this:TwitterFacebook Related