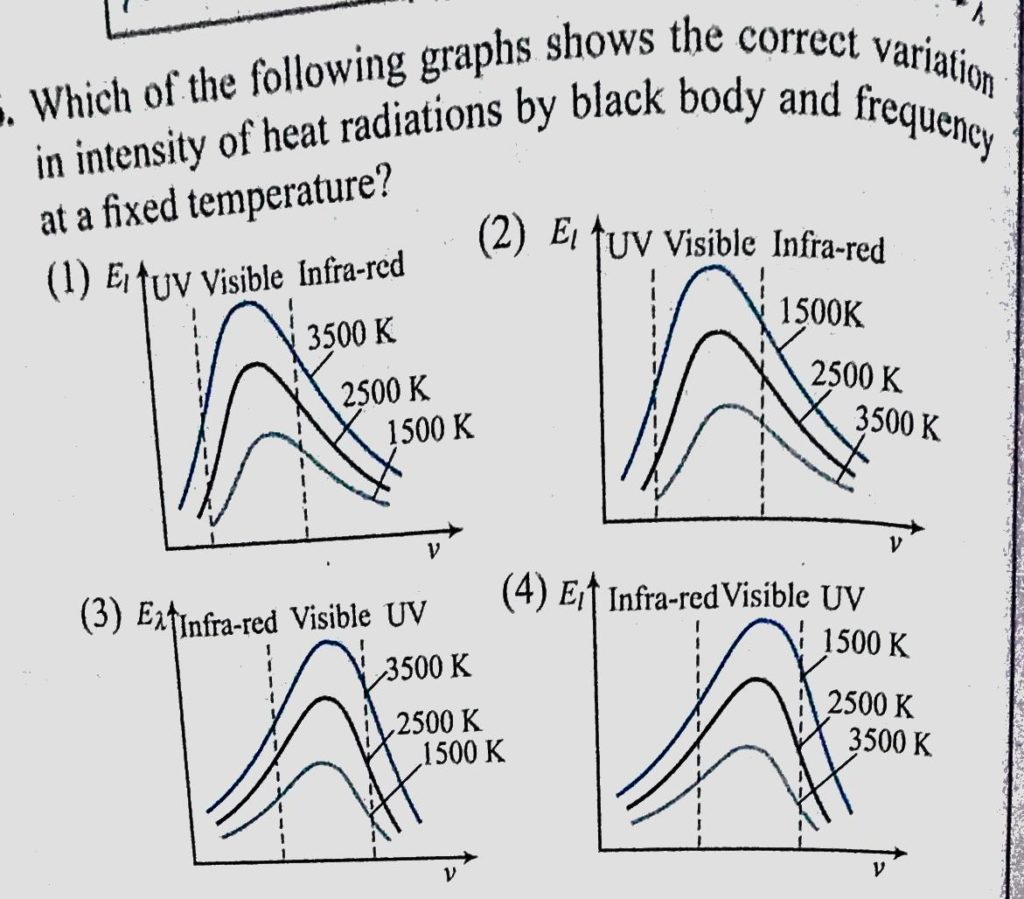
Which of the following graphs shows the correct variation in intensity of heat radiations by black body and frequency at a fixed temperature ? Which of the following graphs shows the correct variation in intensity of heat radiations by black body and frequency at a fixed temperature ? October 25, 2020 Category: Uncategorised (JEE Advanced Physics by BM Sharma + GMP Solutions) , Facebook Messenger WhatsApp Share this:TwitterFacebook Related