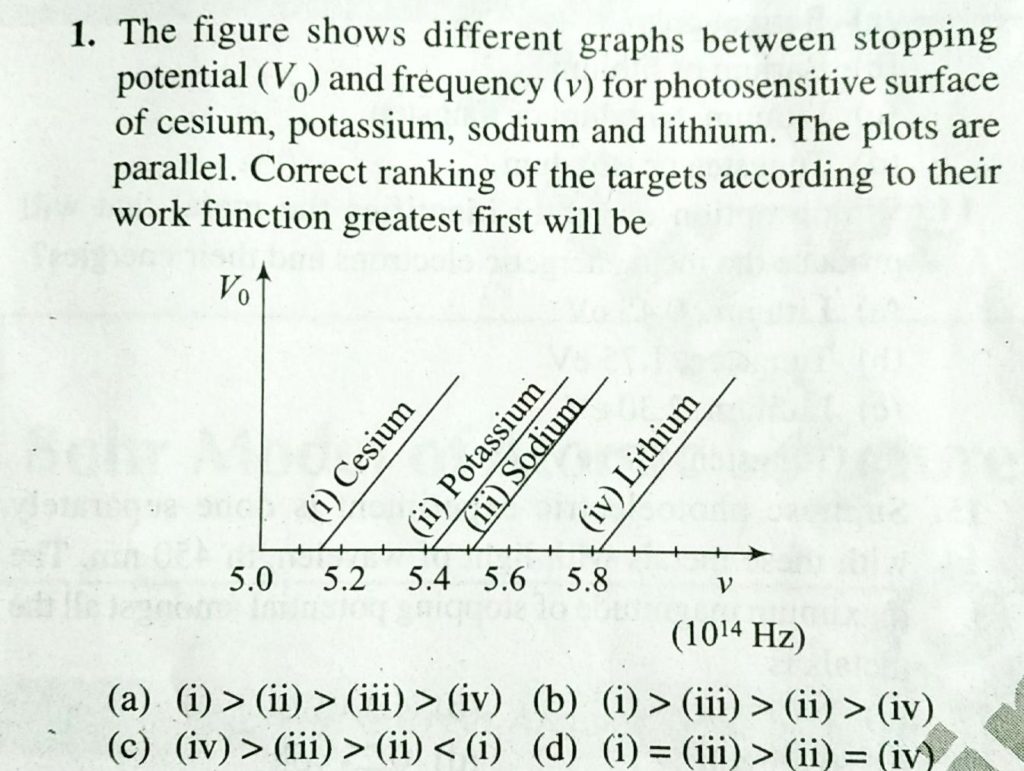
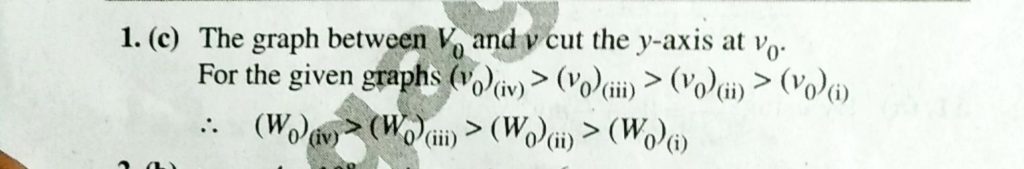
The figure shows different graphs between stopping potential (V0) and frequency (v) for photosensitive surface of cesium , potassium , sodium and lithium. The plots are parallel. Correct ranking of the targets according to their work function greatest first will be