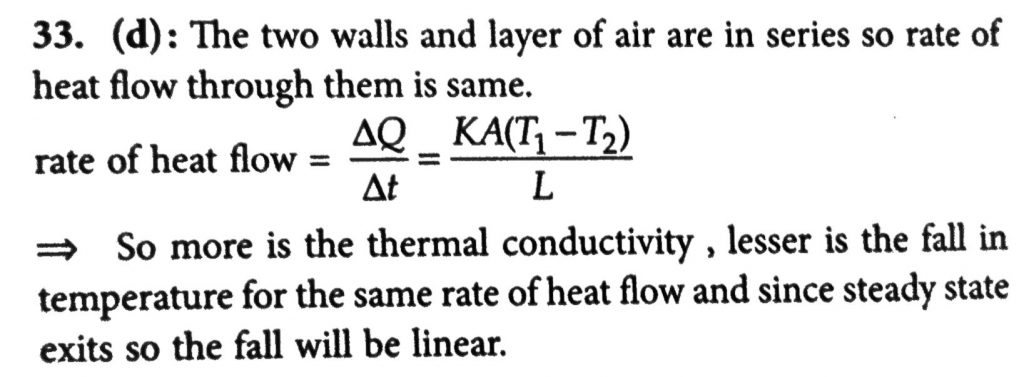
The wall with a cavity consists of two layers of brick separated by a layer of air. All three layers have the same thickness and the thermal conductivity of the brick is much greater than that of air. The left layer is at a higher temperature than the right layer and steady state condition exists. Which of the following graphs predicts correctly the variation of temperature T with distance d inside the cavity?

