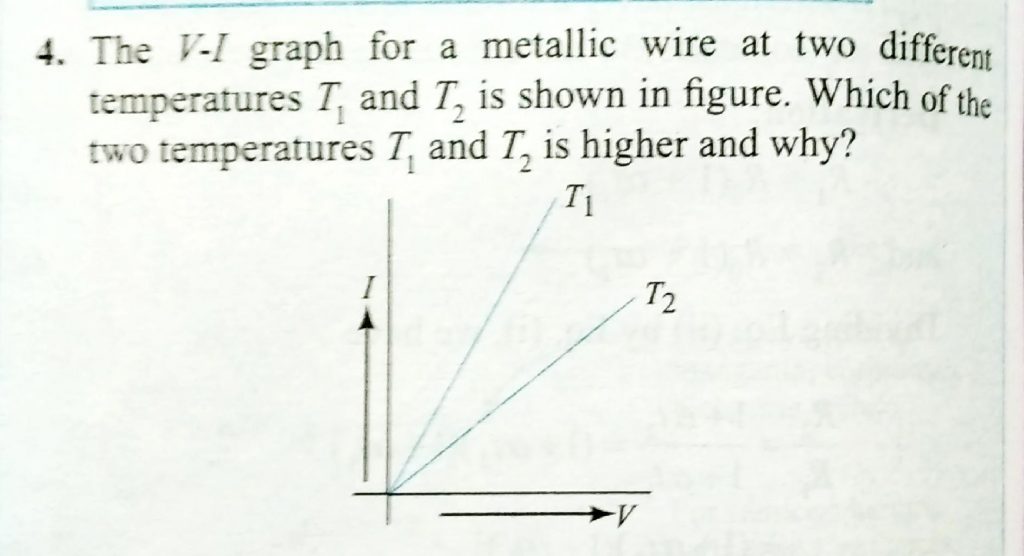
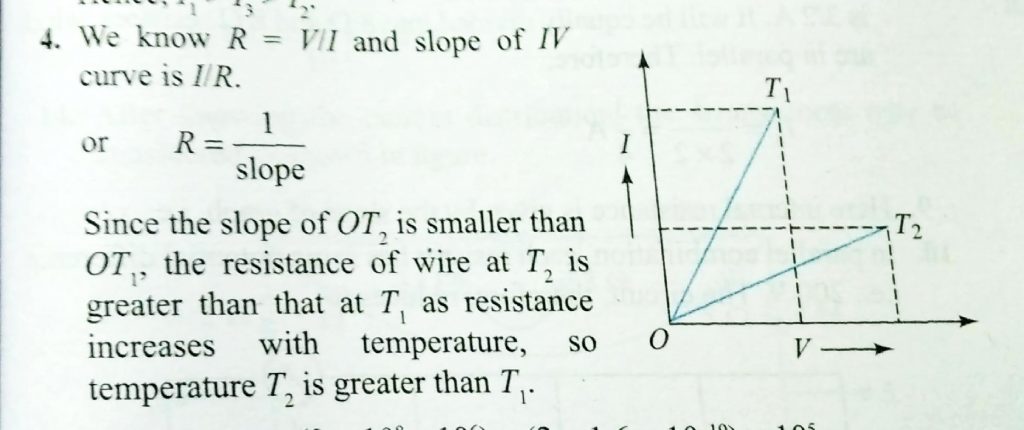
The V- I graph for a metallic wire at two different temperatures T1 and T2 is shown in figure. Which of the two temperatures T1 and T2 is higher and Why ? The V- I graph for a metallic wire at two different temperatures T1 and T2 is shown in figure. Which of the two temperatures T1 and T2 is higher and Why ? November 10, 2020 Category: Uncategorised (JEE Advanced Physics by BM Sharma + GMP Solutions) , Facebook Messenger WhatsApp Share this:TwitterFacebook Related