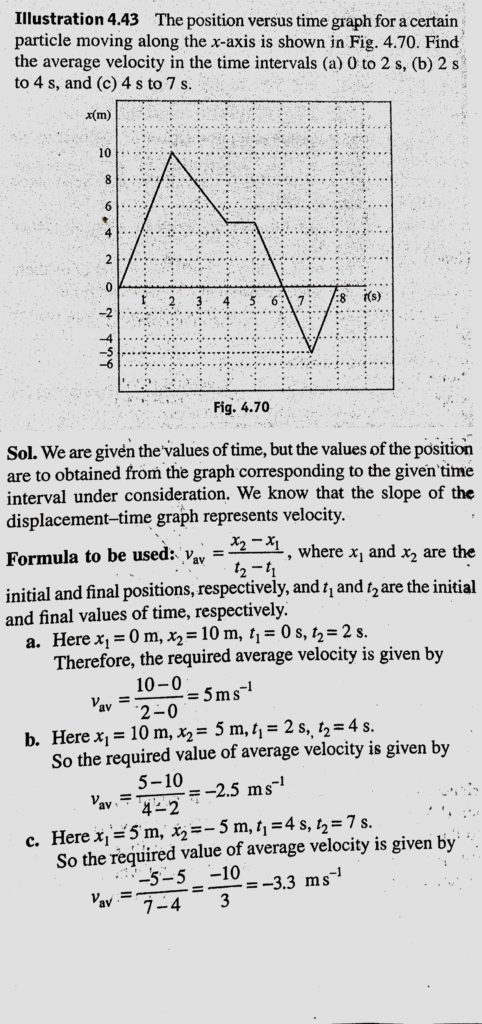
The position versus time graph for a certain particle moving along the x-axis is shown in the figure. Find the average velocity in the time intervals (a) 0 to 2 s, (b) 2 s to 4 s, and (c) 4 s to 7 s. (b) 2 s to 4 s and (c) 4 s to 7 s. The position versus time graph for a certain particle moving along the x-axis is shown in the figure. Find the average velocity in the time intervals (a) 0 to 2 s August 27, 2020 Category: Uncategorised (JEE Advanced Physics by BM Sharma + GMP Solutions) , Facebook Messenger WhatsApp Share this:TwitterFacebook Related