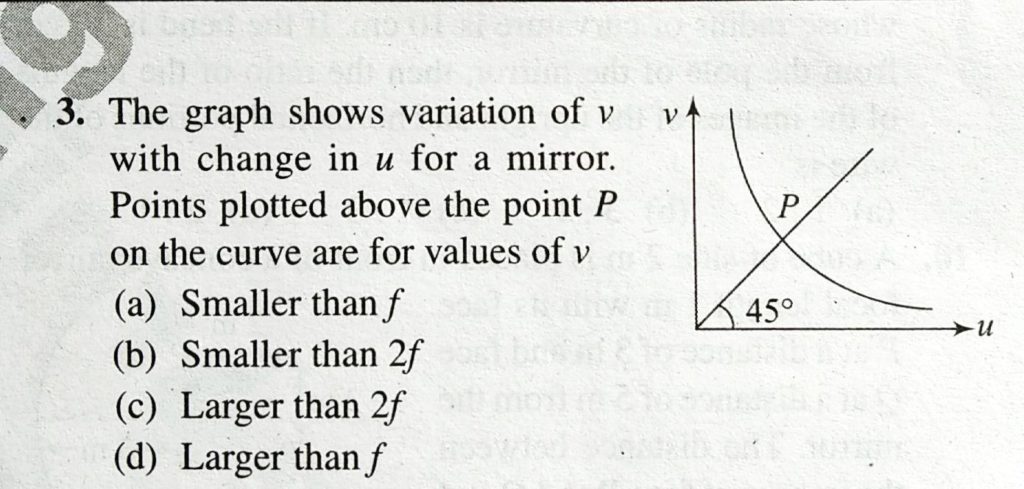
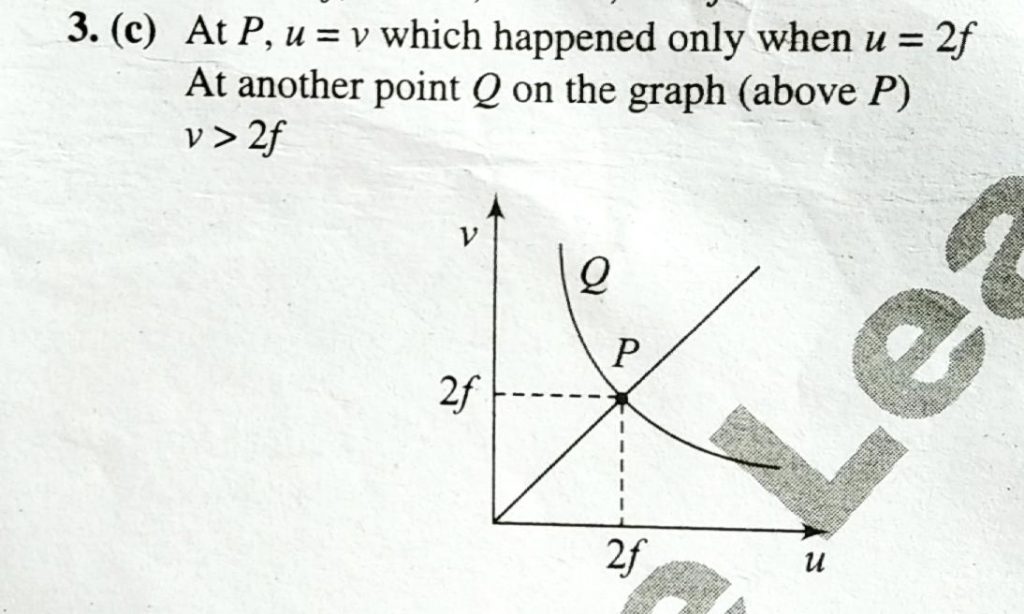
The graph shows variation of v with in u for a mirror. points plotted above the curve are for values of v The graph shows variation of v with in u for a mirror. points plotted above the curve are for values of v September 11, 2020 Category: Uncategorised (JEE Advanced Physics by BM Sharma + GMP Solutions) , Facebook Messenger WhatsApp Share this:TwitterFacebook Related