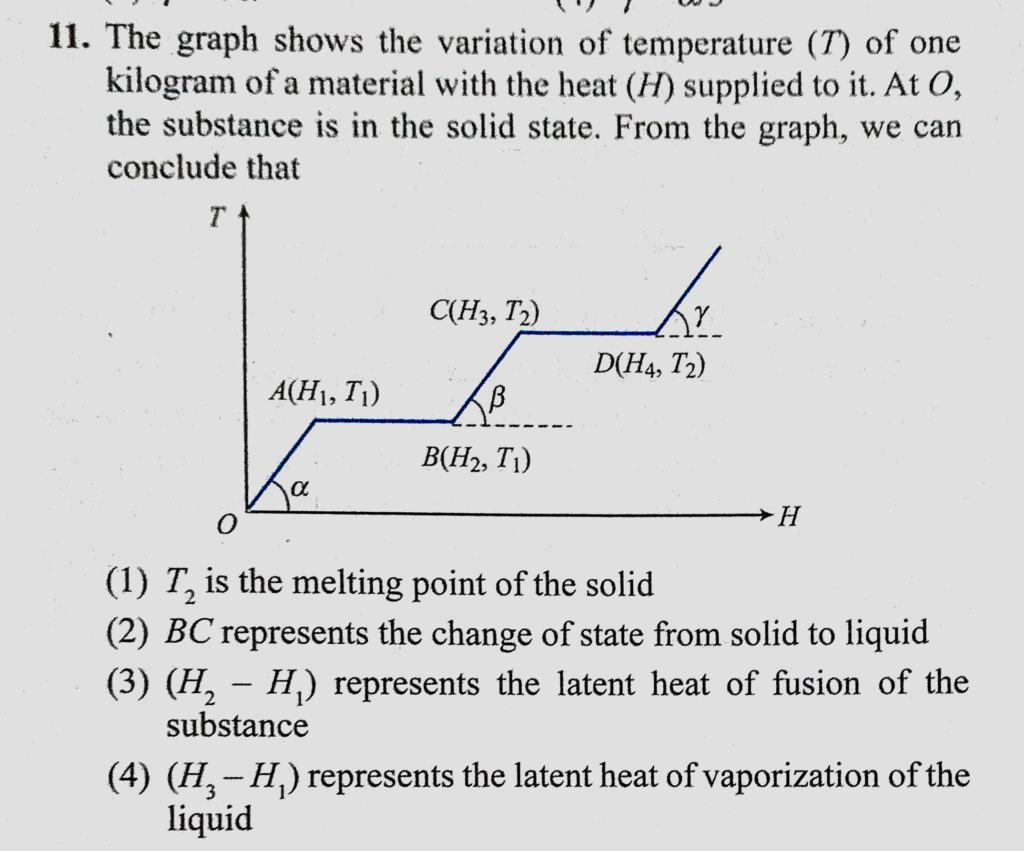
The graph shows the variation of temperature (T) of one kilogram of a material with the heat (H) supplied to it. At O, the substance is in the solid state. From the graph, we can conclude that The graph shows the variation of temperature (T) of one kilogram of a material with the heat (H) supplied to it. At O the substance is in the solid state. From the graph we can conclude that October 23, 2020 Category: Uncategorised (JEE Advanced Physics by BM Sharma + GMP Solutions) , Facebook Messenger WhatsApp Share this:TwitterFacebook Related