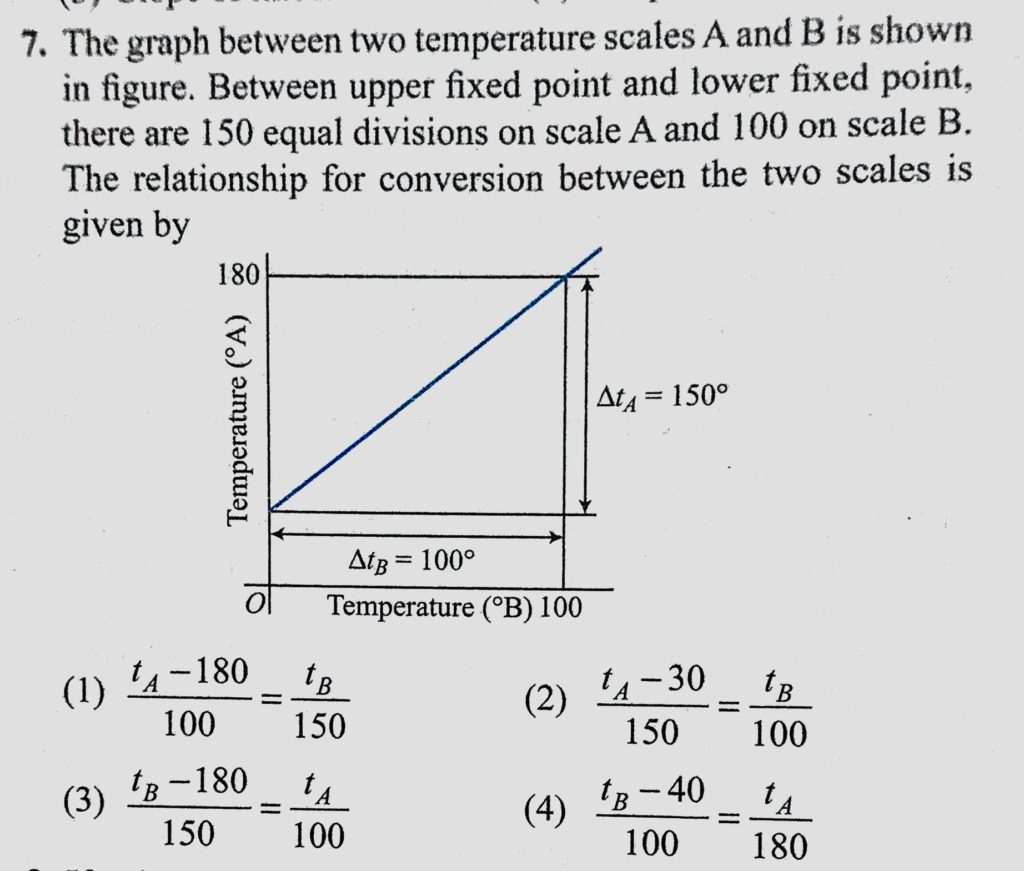
The graph between two temperature scales A and B is shown in figure. Between upper fixed point and lower fixed point, there are 150 equal divisions on scale A and 100 on scale B. The graph between two temperature scales A and B is shown in figure. Between upper fixed point and lower fixed point there are 150 equal divisions on scale A and 100 on scale B. October 23, 2020 Category: Uncategorised (JEE Advanced Physics by BM Sharma + GMP Solutions) , Facebook Messenger WhatsApp Share this:TwitterFacebook Related