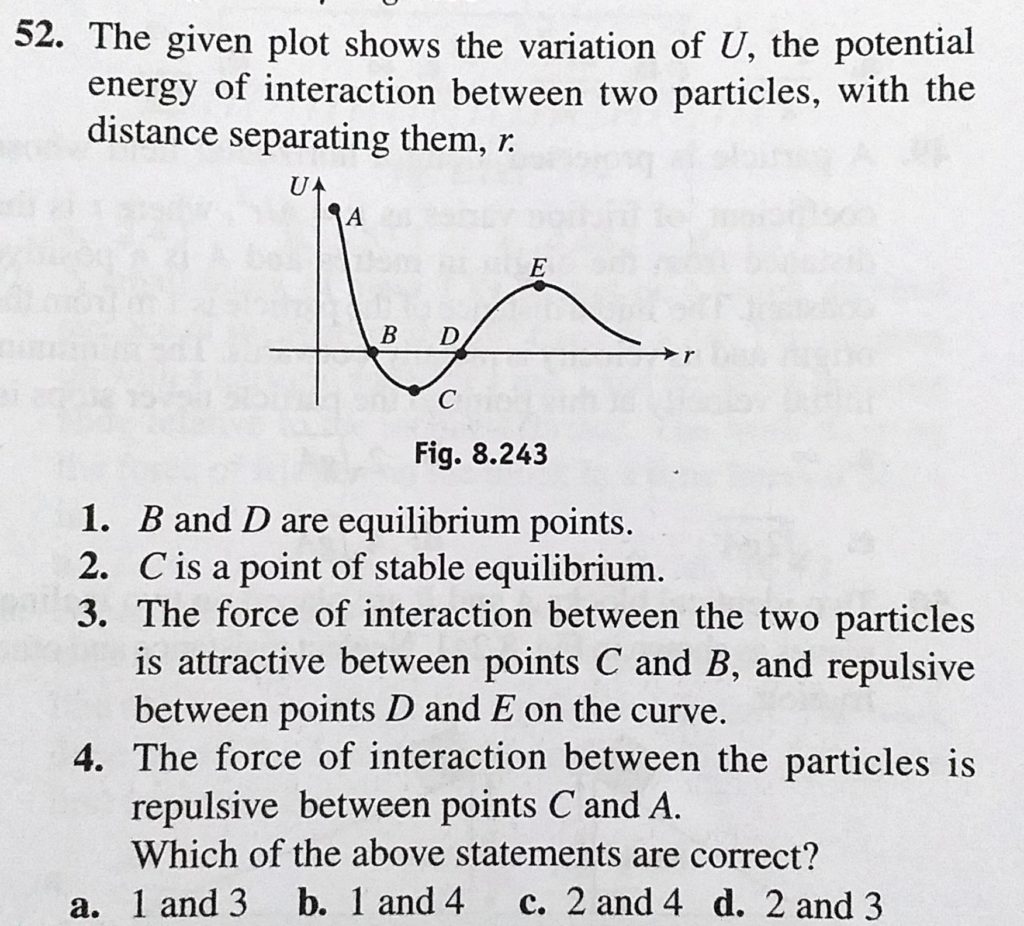
The given plot shows the variation of U, the potential energy of interaction between two particles, with the distance separating them, r. 1. B and D are equilibrium points. r. 1. B and D are equilibrium points. The given plot shows the variation of U the potential energy of interaction between two particles with the distance separating them October 4, 2020 Category: Uncategorised (JEE Advanced Physics by BM Sharma + GMP Solutions) , Facebook Messenger WhatsApp Share this:TwitterFacebook Related