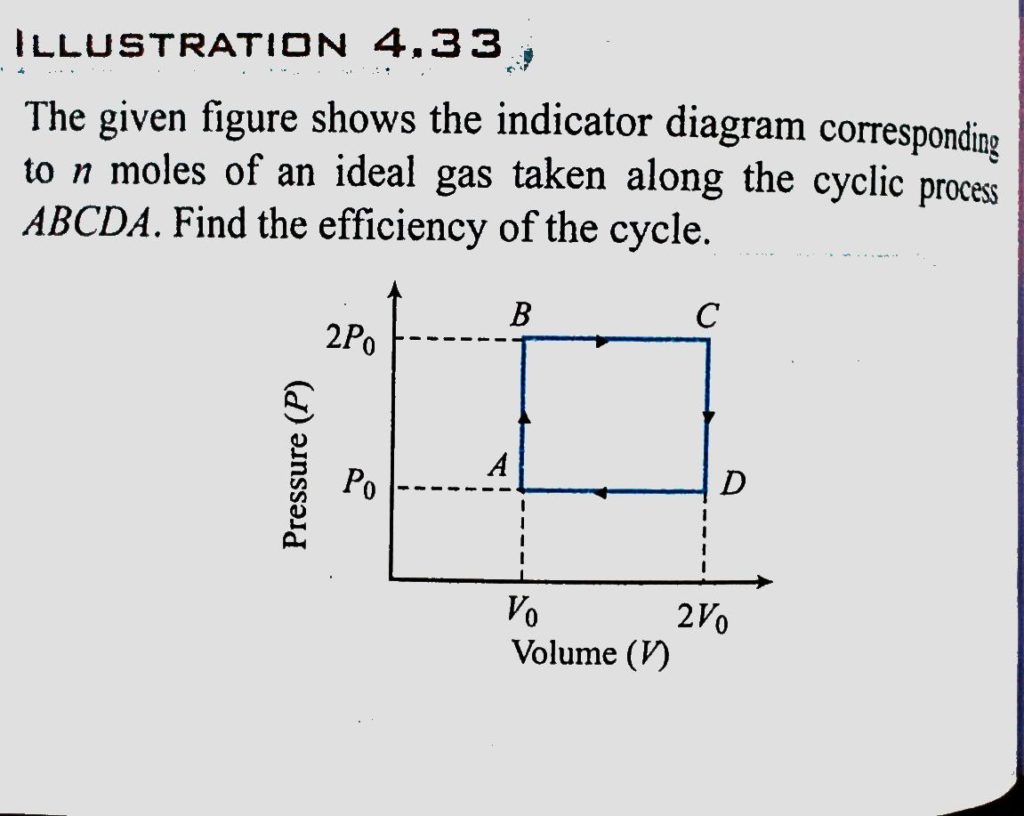
The given figure shows the indicator diagram corresponding to n moles of an ideal gas taken along the cyclic process ABCDA. Find the efficiency of the cycle. The given figure shows the indicator diagram corresponding to n moles of an ideal gas taken along the cyclic process ABCDA. Find the efficiency of the cycle. September 3, 2020 Category: Uncategorised (JEE Advanced Physics by BM Sharma + GMP Solutions) , Facebook Messenger WhatsApp Share this:TwitterFacebook Related