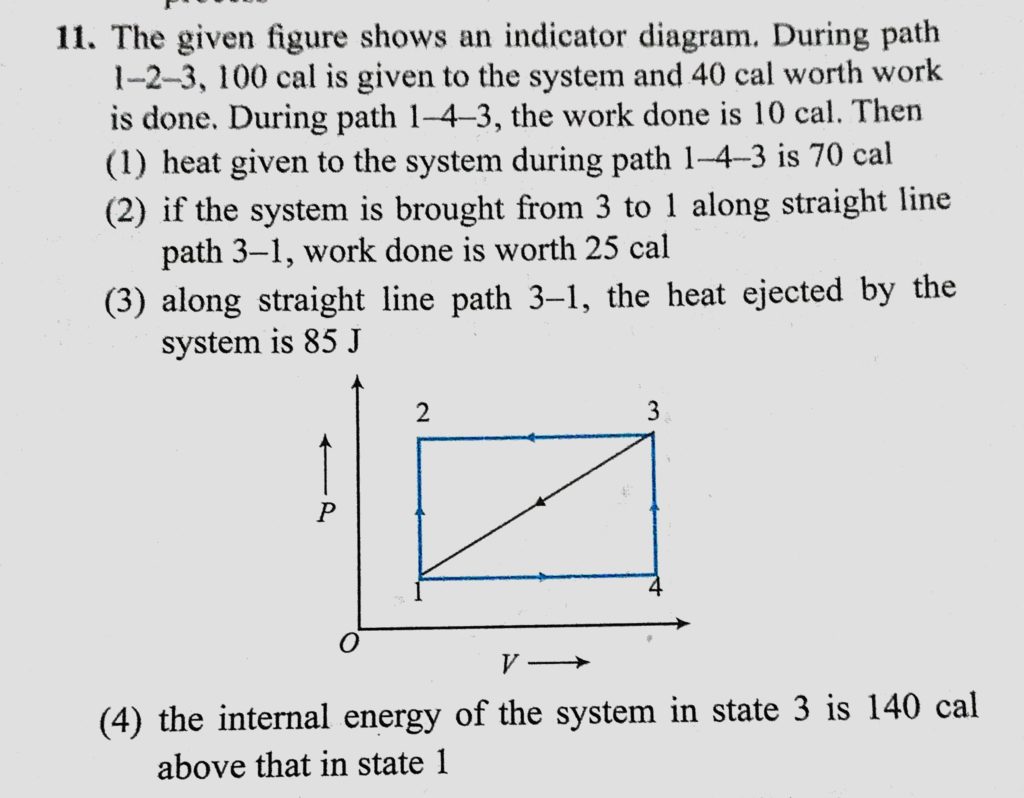
The given figure shows an indicator diagram. During path 1 to 2 to 3, 100 cal is given to the system and 40 cal worth work is done. During path 1 to 4 to 3, the work done is 10 cal. Then 100 cal is given to the system and 40 cal worth work is done. During path 1 to 4 to 3 The given figure shows an indicator diagram. During path 1 to 2 to 3 the work done is 10 cal. Then October 29, 2020 Category: Uncategorised (JEE Advanced Physics by BM Sharma + GMP Solutions) , Facebook Messenger WhatsApp Share this:TwitterFacebook Related