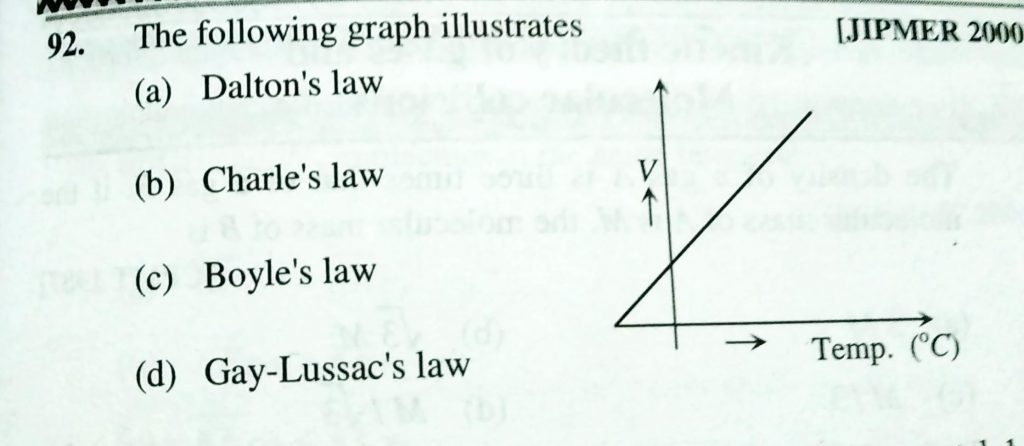
The following graph illustrates (a) Dalton’s law (b) Charle’s law (c) Boyle’s law (d) Gay- Lussac”s law The following graph illustrates (a) Dalton's law (b) Charle's law (c) Boyle's law (d) Gay- Lussac''s law February 11, 2021 Category: Uncategorised (JEE Advanced Physics by BM Sharma + GMP Solutions) , Facebook Messenger WhatsApp Share this:TwitterFacebook Related