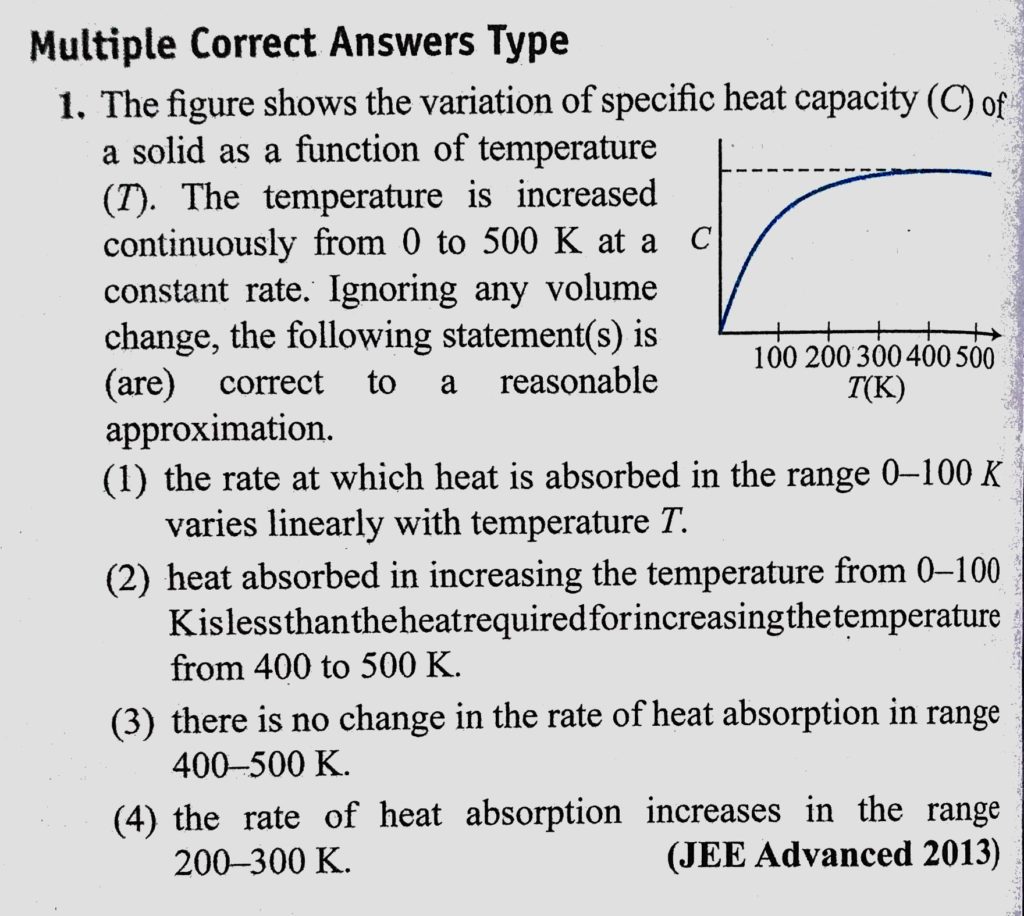
The figure shows the variation of specific heat capacity (C) of a solid as a function of temperature (T). The temperature is increased continuously from 0 to 500 K at a constant rate. The figure shows the variation of specific heat capacity (C) of a solid as a function of temperature (T). The temperature is increased continuously from 0 to 500 K at a constant rate. October 24, 2020 Category: Uncategorised (JEE Advanced Physics by BM Sharma + GMP Solutions) , Facebook Messenger WhatsApp Share this:TwitterFacebook Related