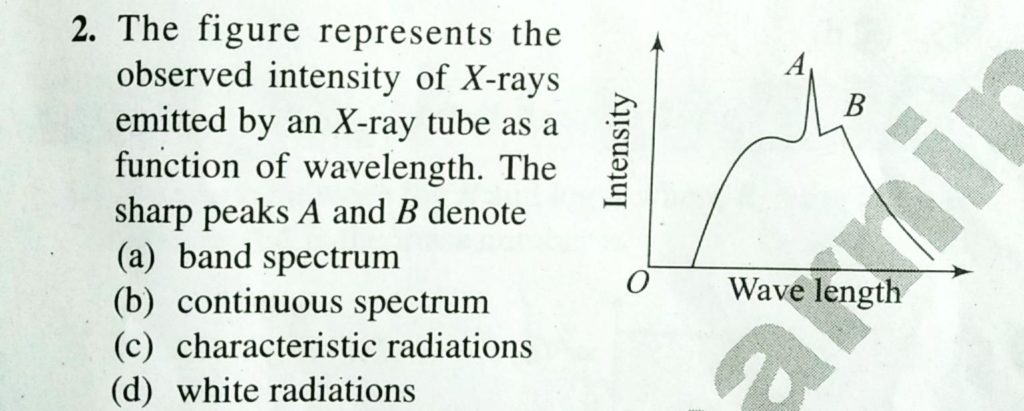
The figure represents the observed intensity by an X -ray tube as function of wavelength. The sharp peaks A and B denote The figure represents the observed intensity by an X -ray tube as function of wavelength. The sharp peaks A and B denote September 14, 2020 Category: Uncategorised (JEE Advanced Physics by BM Sharma + GMP Solutions) , Facebook Messenger WhatsApp Share this:TwitterFacebook Related