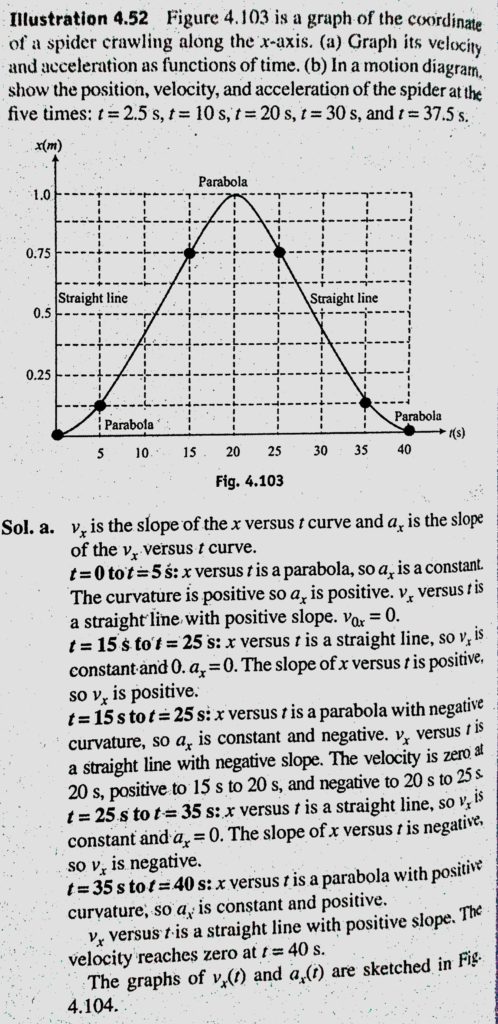
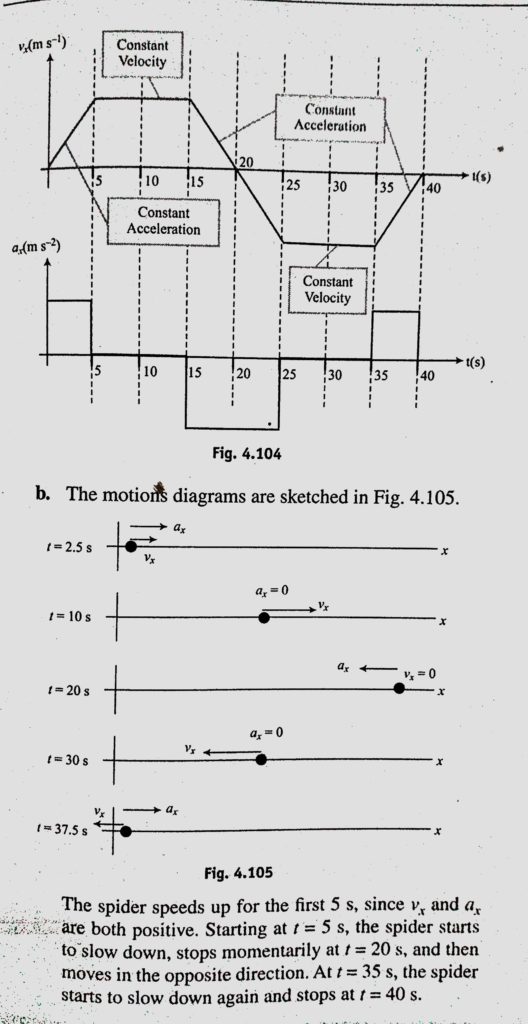
The figure is a graph of the coordinate of a spider crawling along the x-axis. (a) Graph its velocity and acceleration as functions of time, (b) In a motion diagram, show the position, velocity, and acceleration of the spider at the five times: t=2.5 s, t = 10 s, t = 20 s, /=30 s, and t=37.5 s.