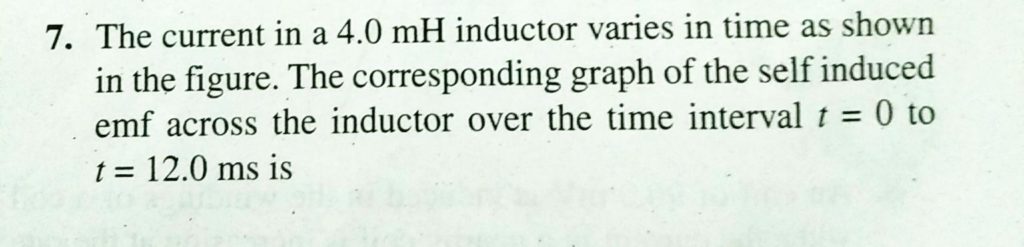
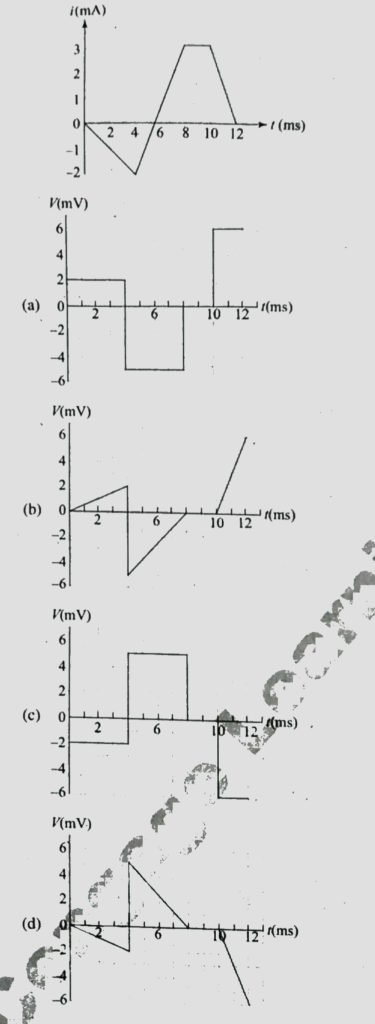
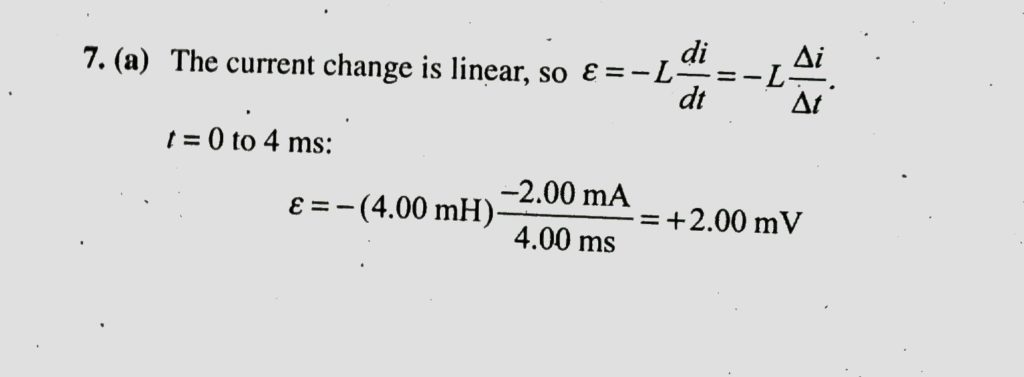
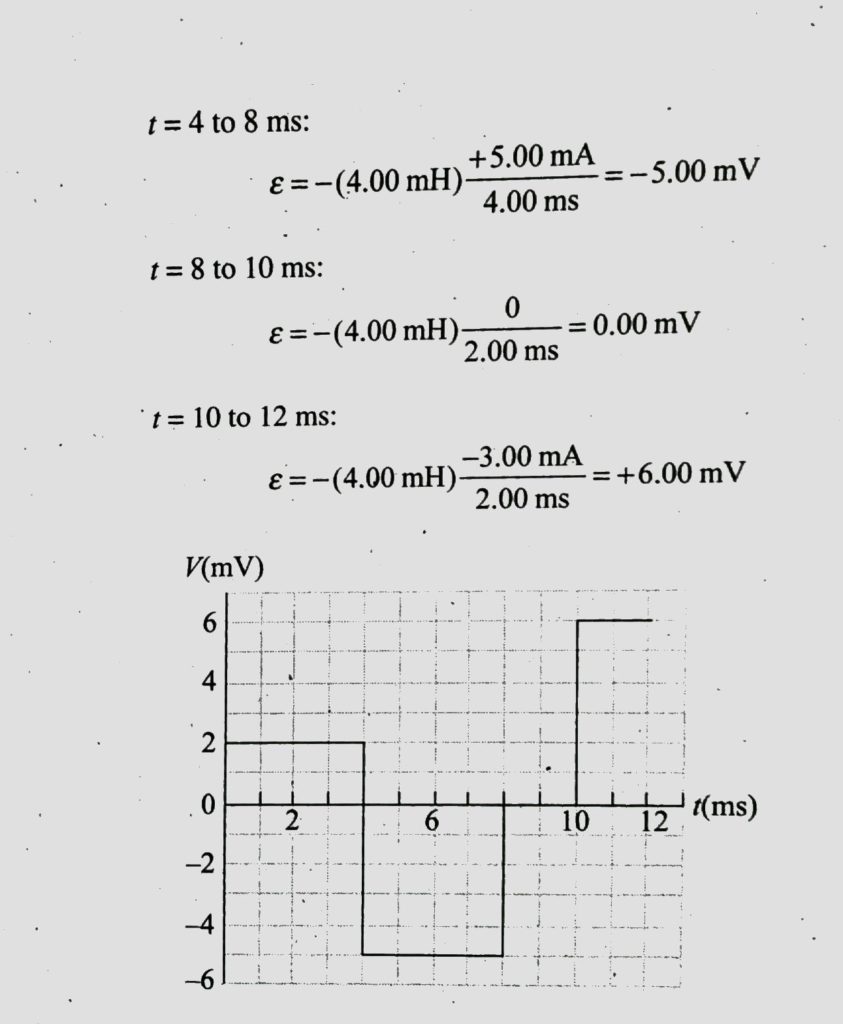
The current in a 4 mH inductor varies in time as shown in the figure. The corresponding graph of the self induced emf across the inductor over the time interval t = 0 to t = 12 ms is The current in a 4 mH inductor varies in time as shown in the figure. The corresponding graph of the self induced emf across the inductor over the time interval t = 0 to t = 12 ms is September 10, 2020 Category: Uncategorised (JEE Advanced Physics by BM Sharma + GMP Solutions) , Facebook Messenger WhatsApp Share this:TwitterFacebook Related