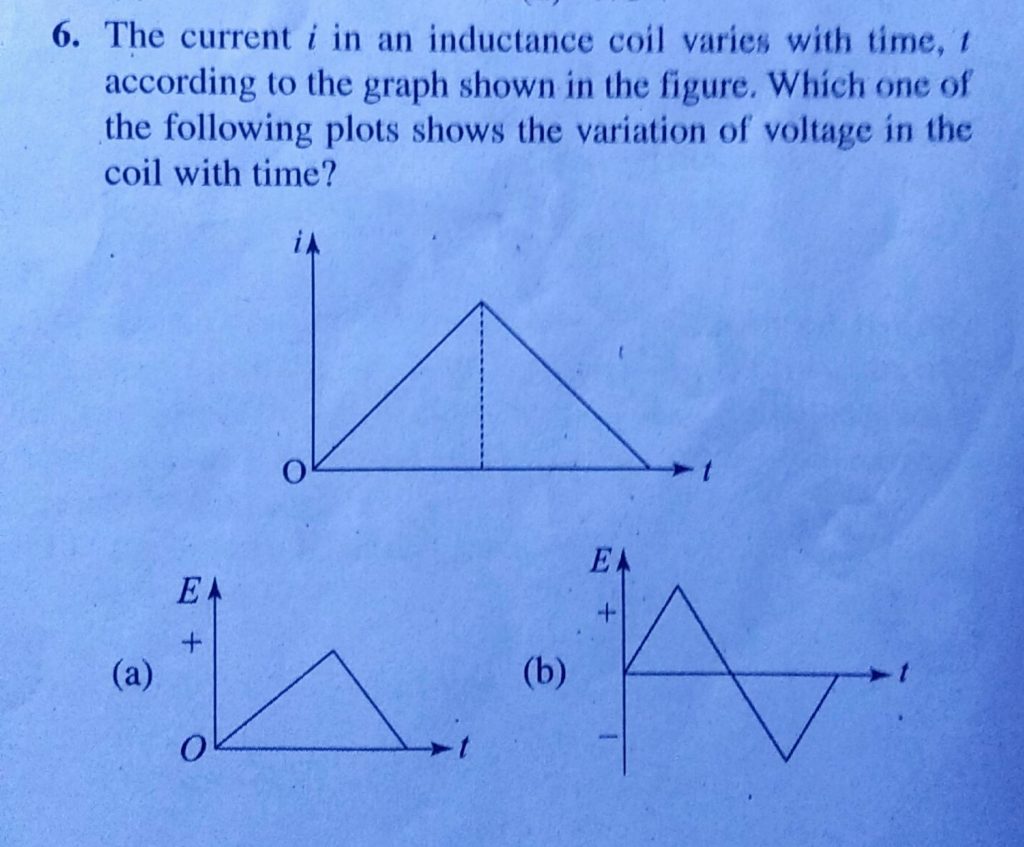
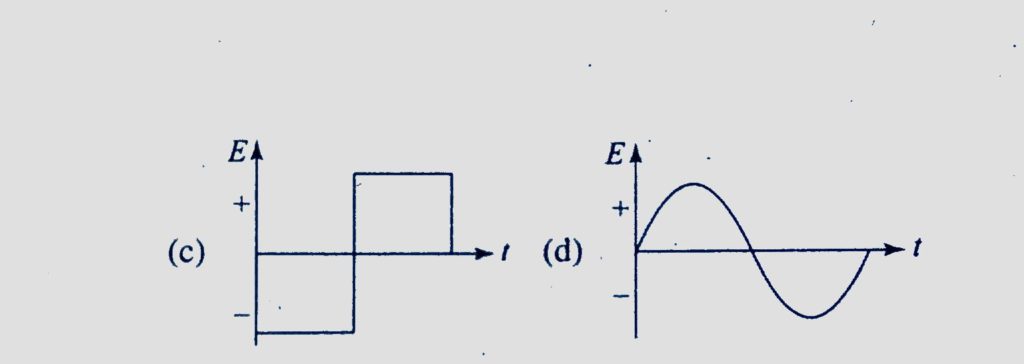
The current i in an inductance coil varies with time, t according to the graph shown in the figure. Which one of the following plots shows the variation of voltage in the coil with time? t according to the graph shown in the figure. Which one of the following plots shows the variation of voltage in the coil with time? The current i in an inductance coil varies with time September 10, 2020 Category: Uncategorised (JEE Advanced Physics by BM Sharma + GMP Solutions) , Facebook Messenger WhatsApp Share this:TwitterFacebook Related