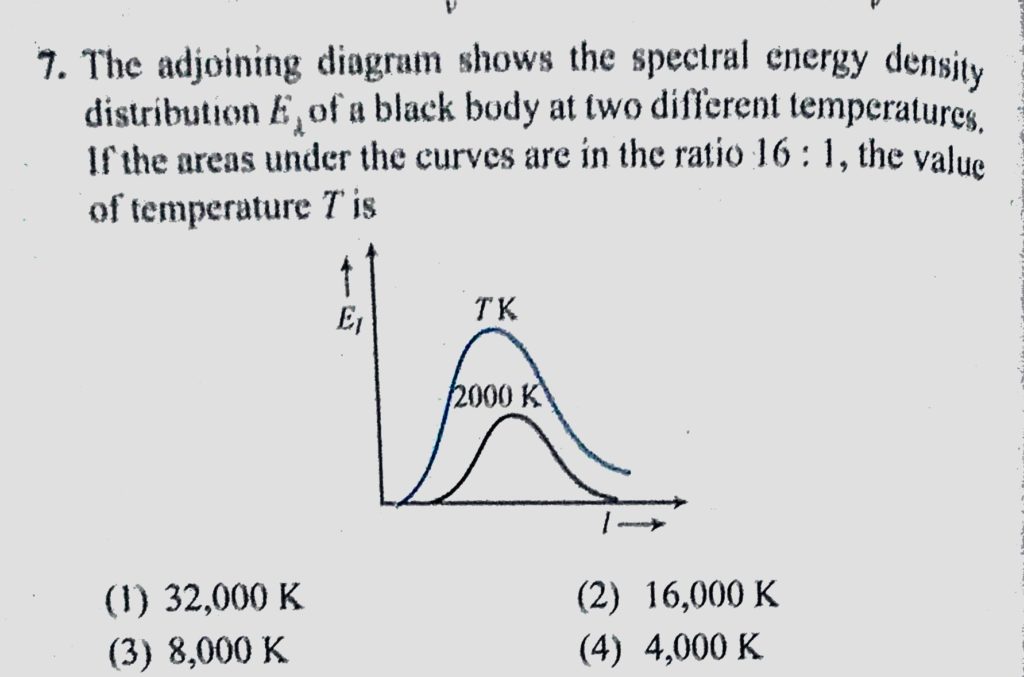
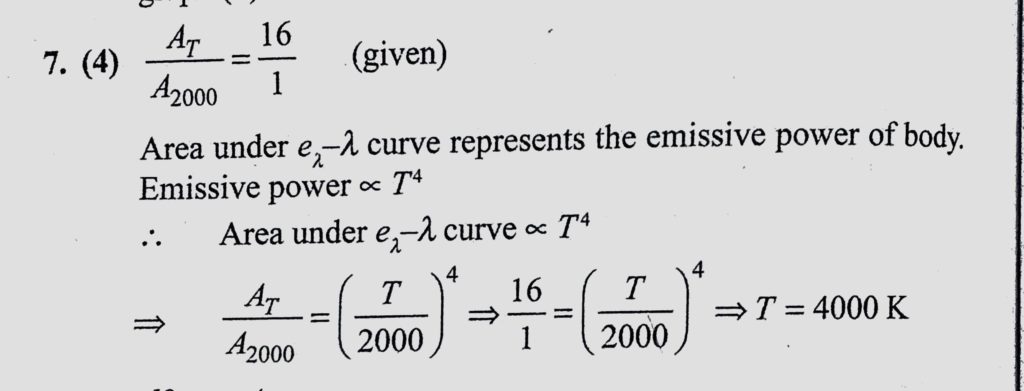
The adjoining diagrams shows the spectral energy density distribution E lemda of a black body at two different temperatures. If the areas under the curves are in the ratio 16 : 1, the value The adjoining diagrams shows the spectral energy density distribution E lemda of a black body at two different temperatures. If the areas under the curves are in the ratio 16 : 1 the value October 25, 2020 Category: Uncategorised (JEE Advanced Physics by BM Sharma + GMP Solutions) , Facebook Messenger WhatsApp Share this:TwitterFacebook Related