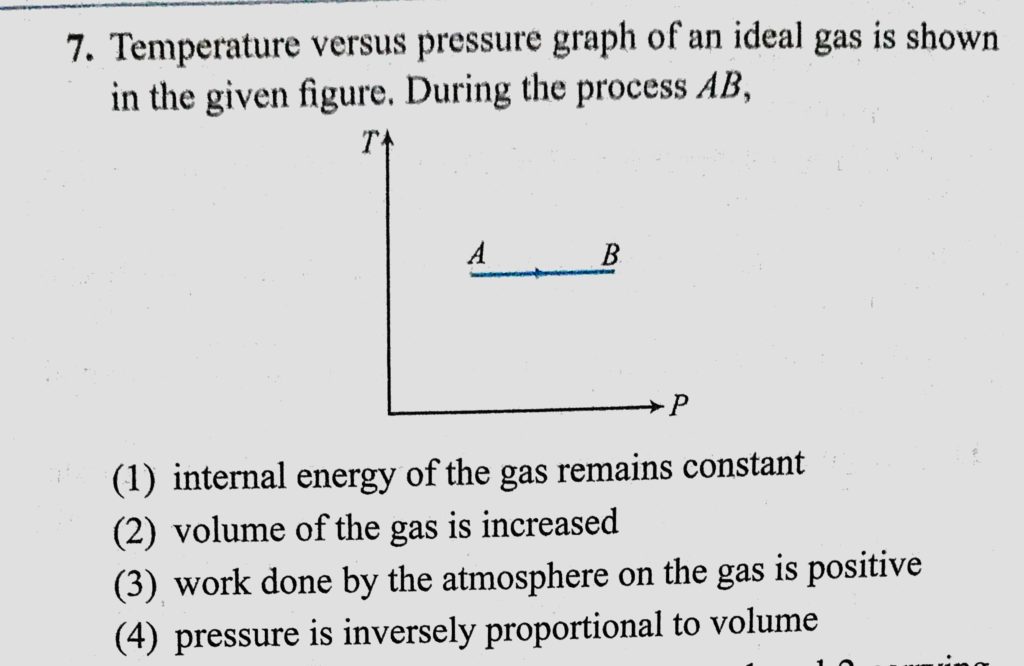
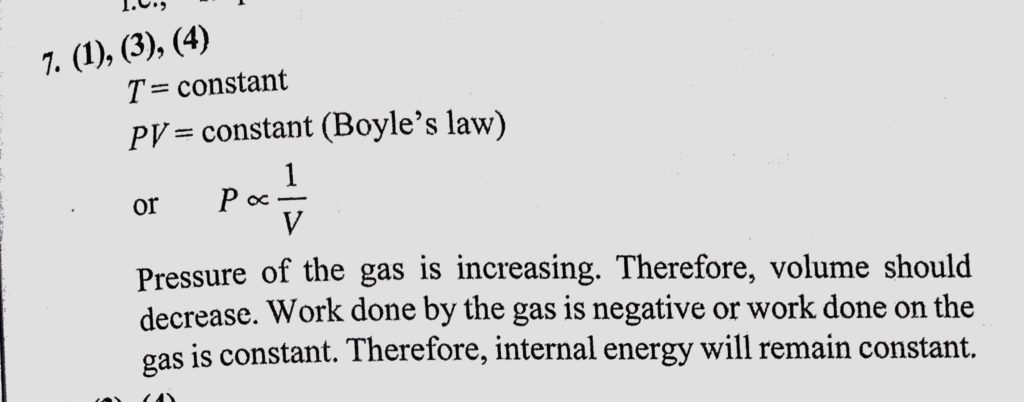
Temperature versus pressure graph of an ideal gas is shown in the given figure. During the process AB, Temperature versus pressure graph of an ideal gas is shown in the given figure. During the process AB October 29, 2020 Category: Uncategorised (JEE Advanced Physics by BM Sharma + GMP Solutions) , Facebook Messenger WhatsApp Share this:TwitterFacebook Related