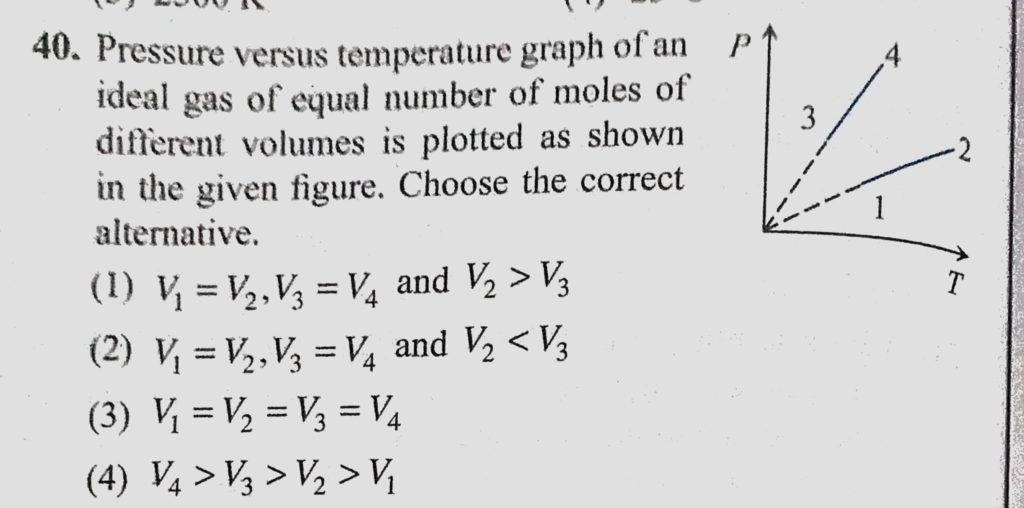
Pressure versus temperature graph of an ideal gas of equal number of moles of different volumes is plotted as shown in the given figure. Choose the correct alternative. Pressure versus temperature graph of an ideal gas of equal number of moles of different volumes is plotted as shown in the given figure. Choose the correct alternative. October 27, 2020 Category: Uncategorised (JEE Advanced Physics by BM Sharma + GMP Solutions) , Facebook Messenger WhatsApp Share this:TwitterFacebook Related