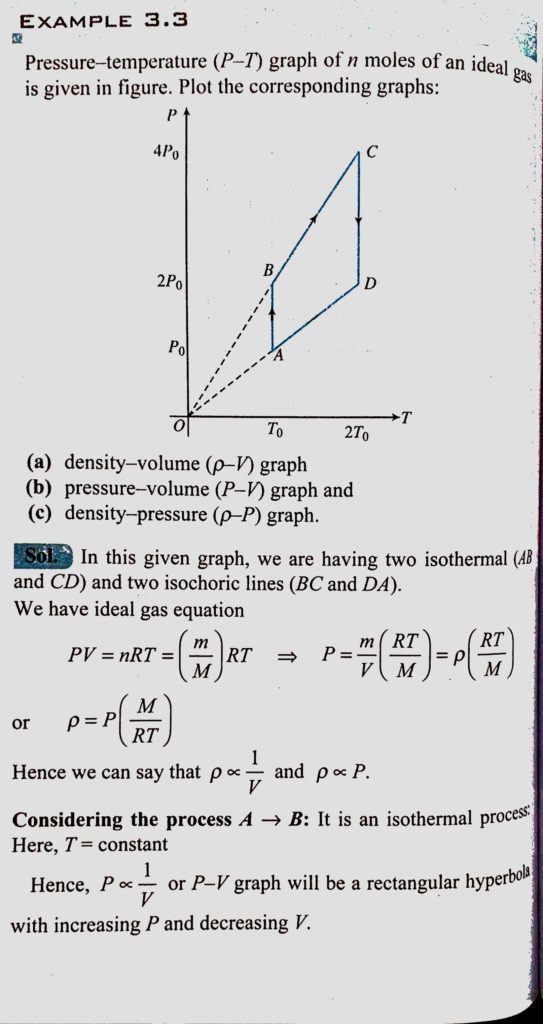
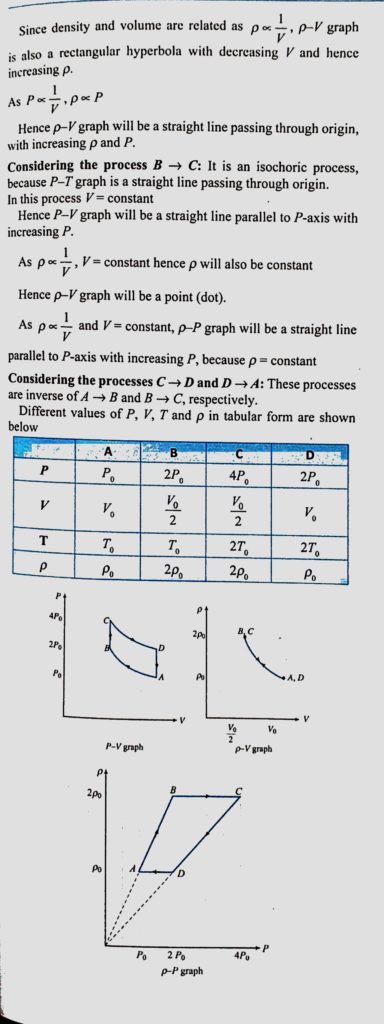
Pressure- temperature graph of n moles of an ideal gas is given in figure. Plot the corresponding graphs: (a) density-volume (p-v) graph (b) Pressure- temperature graph of n moles of an ideal gas is given in figure. Plot the corresponding graphs: (a) density-volume (p-v) graph (b) September 2, 2020 Category: Uncategorised (JEE Advanced Physics by BM Sharma + GMP Solutions) , Facebook Messenger WhatsApp Share this:TwitterFacebook Related