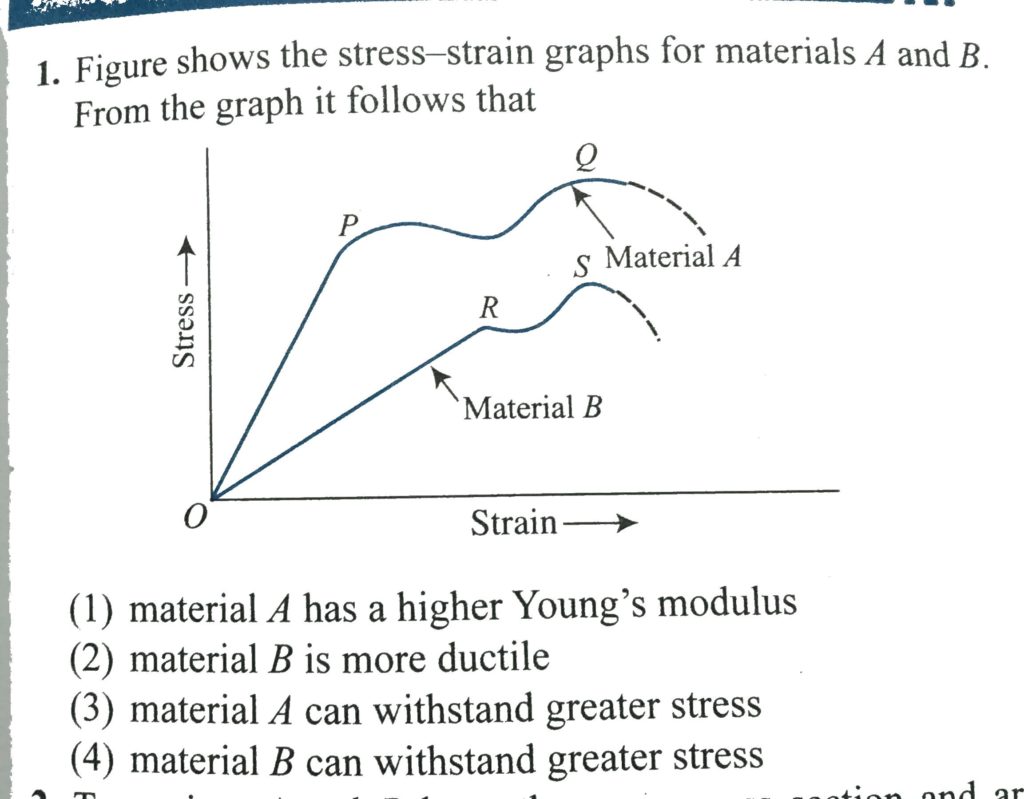
Figure shows the stress – strain graphs for materials A and B . From the graph it follows that Figure shows the stress - strain graphs for materials A and B . From the graph it follows that October 10, 2020 Category: Uncategorised (JEE Advanced Physics by BM Sharma + GMP Solutions) , Facebook Messenger WhatsApp Share this:TwitterFacebook Related