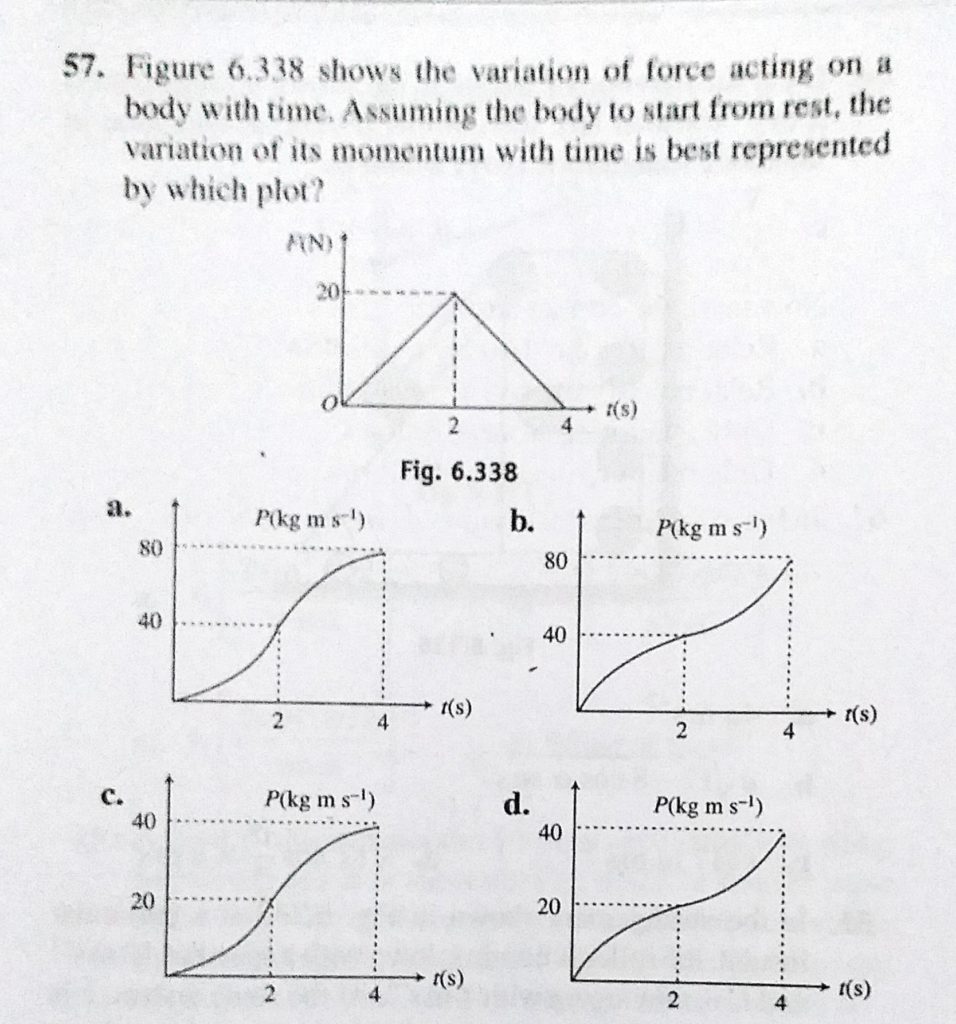
Figure 6.338 shows the variation of force action on a body with time. Assuming the body to start from rest, the variation of its momentum with time is best represented by which plot? Figure 6.338 shows the variation of force action on a body with time. Assuming the body to start from rest the variation of its momentum with time is best represented by which plot? September 29, 2020 Category: Uncategorised (JEE Advanced Physics by BM Sharma + GMP Solutions) , Facebook Messenger WhatsApp Share this:TwitterFacebook Related