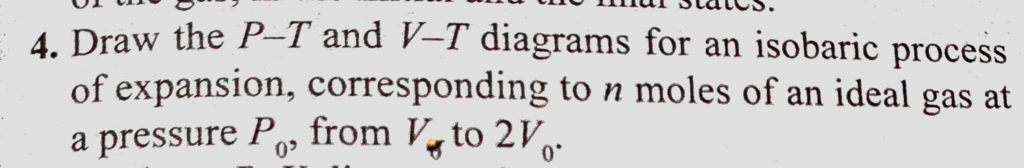
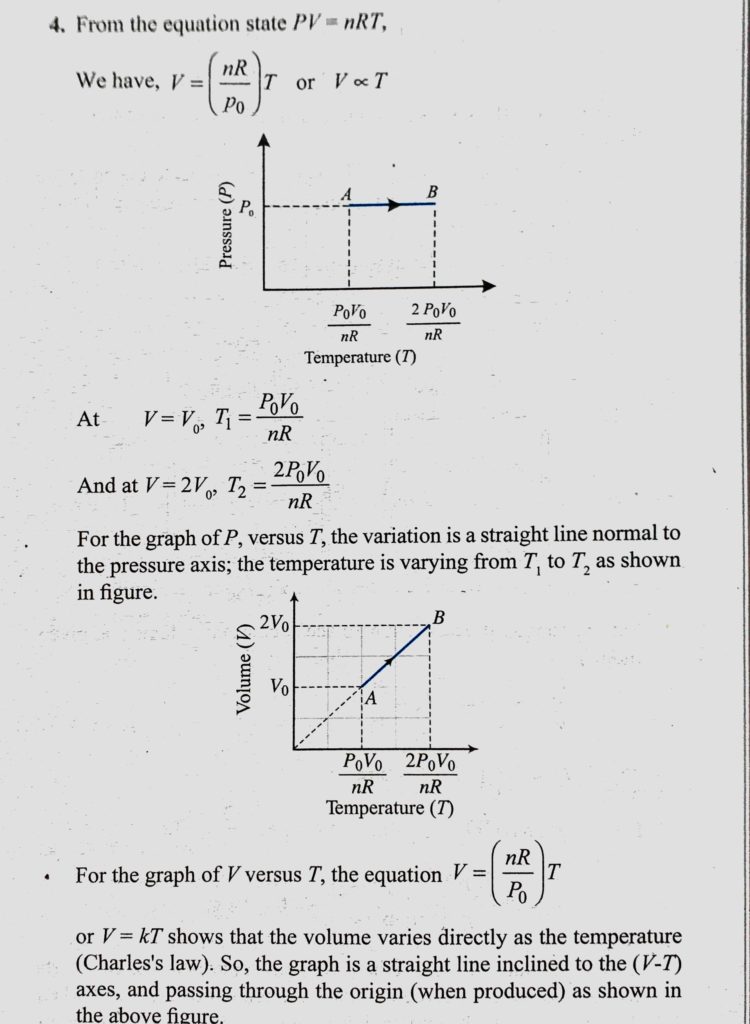
Draw the P-T and V-T diagrams for an isobaric process of expansion, corresponding to n moles of an ideal gas at a pressure P0, from V0 to 2V0. corresponding to n moles of an ideal gas at a pressure P0 Draw the P-T and V-T diagrams for an isobaric process of expansion from V0 to 2V0. October 27, 2020 Category: Uncategorised (JEE Advanced Physics by BM Sharma + GMP Solutions) , Facebook Messenger WhatsApp Share this:TwitterFacebook Related